Monitor Models
In Production
Real-time observability for computer vision models. Detect anomalies, track drift, and close the feedback loop automatically.
Catch failures before users do
Automatic 24/7 monitoring flags anomalous inputs and low-confidence predictions. Reveal blindspots and discover edge cases in production data.
Low Confidence Alerts
Flag predictions below confidence thresholds automatically
Distribution Shift
Detect when production data drifts from training data
Novel Patterns
Discover previously unseen data patterns and edge cases




Real-time prediction insights
Filter millions of inferences to identify the top anomalies. From edge case detection to training dataset integration in seconds.
Total Inferences
Last 24 hours
Avg Latency
P50 response time
Accuracy
Based on reviewed predictions
# Monitor from file
deployment.monitor(
  "image.jpg",
  tags=["production"]
)

# Monitor from bytes
deployment.monitor_bytes(
  "frame.jpg",
  raw_bytes
)
# Get deployment stats
stats = deployment.get_stats(
window="24h"
)
# Access metrics
print(stats.predictions)
print(stats.reviews)
print(stats.latency_p99)Track distribution changes
Compare production data against your training baseline. Get alerted when distributions shift beyond acceptable thresholds.
Close the feedback loop
Convert production failures into training data. Review predictions, attach to datasets, and trigger retraining automatically.
Continuous Training
Automatically trigger retraining when prediction review thresholds are met. Keep models fresh with production data.
deployment.toggle_continuous_training()Continuous Deployment
Manage model promotion policies between staging and production. Shadow model support for A/B testing.
deployment.set_shadow_model(new_version)Ready to monitor your models?
Start detecting anomalies, tracking drift, and improving models with production feedback.
Related reading
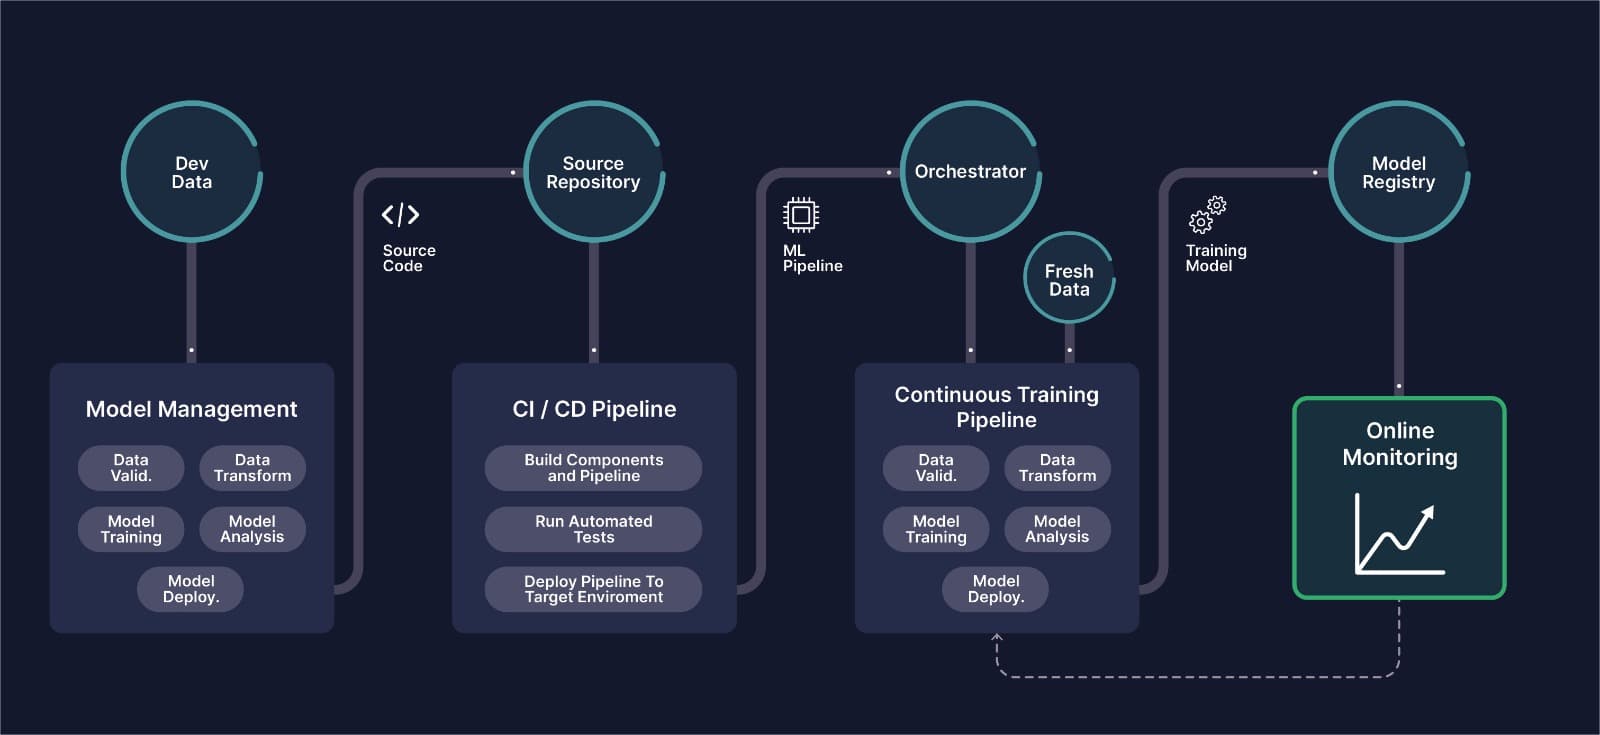
MLOps for Computer Vision: The Complete Guide
What CVOps actually means, why classical MLOps tooling breaks down on image and video data, and how the six stages of a computer vision pipeline fit together in production.
Model Monitoring for Machine Learning in Production
A practical look at the tools available for monitoring machine learning models in production — drift detection, performance tracking, and what to actually watch for.
Key Metrics To Monitor Computer Vision Solutions
In computer vision high-quality training data doesn't ensure high-performing production models. The work begins after deployment, and monitoring is a must.
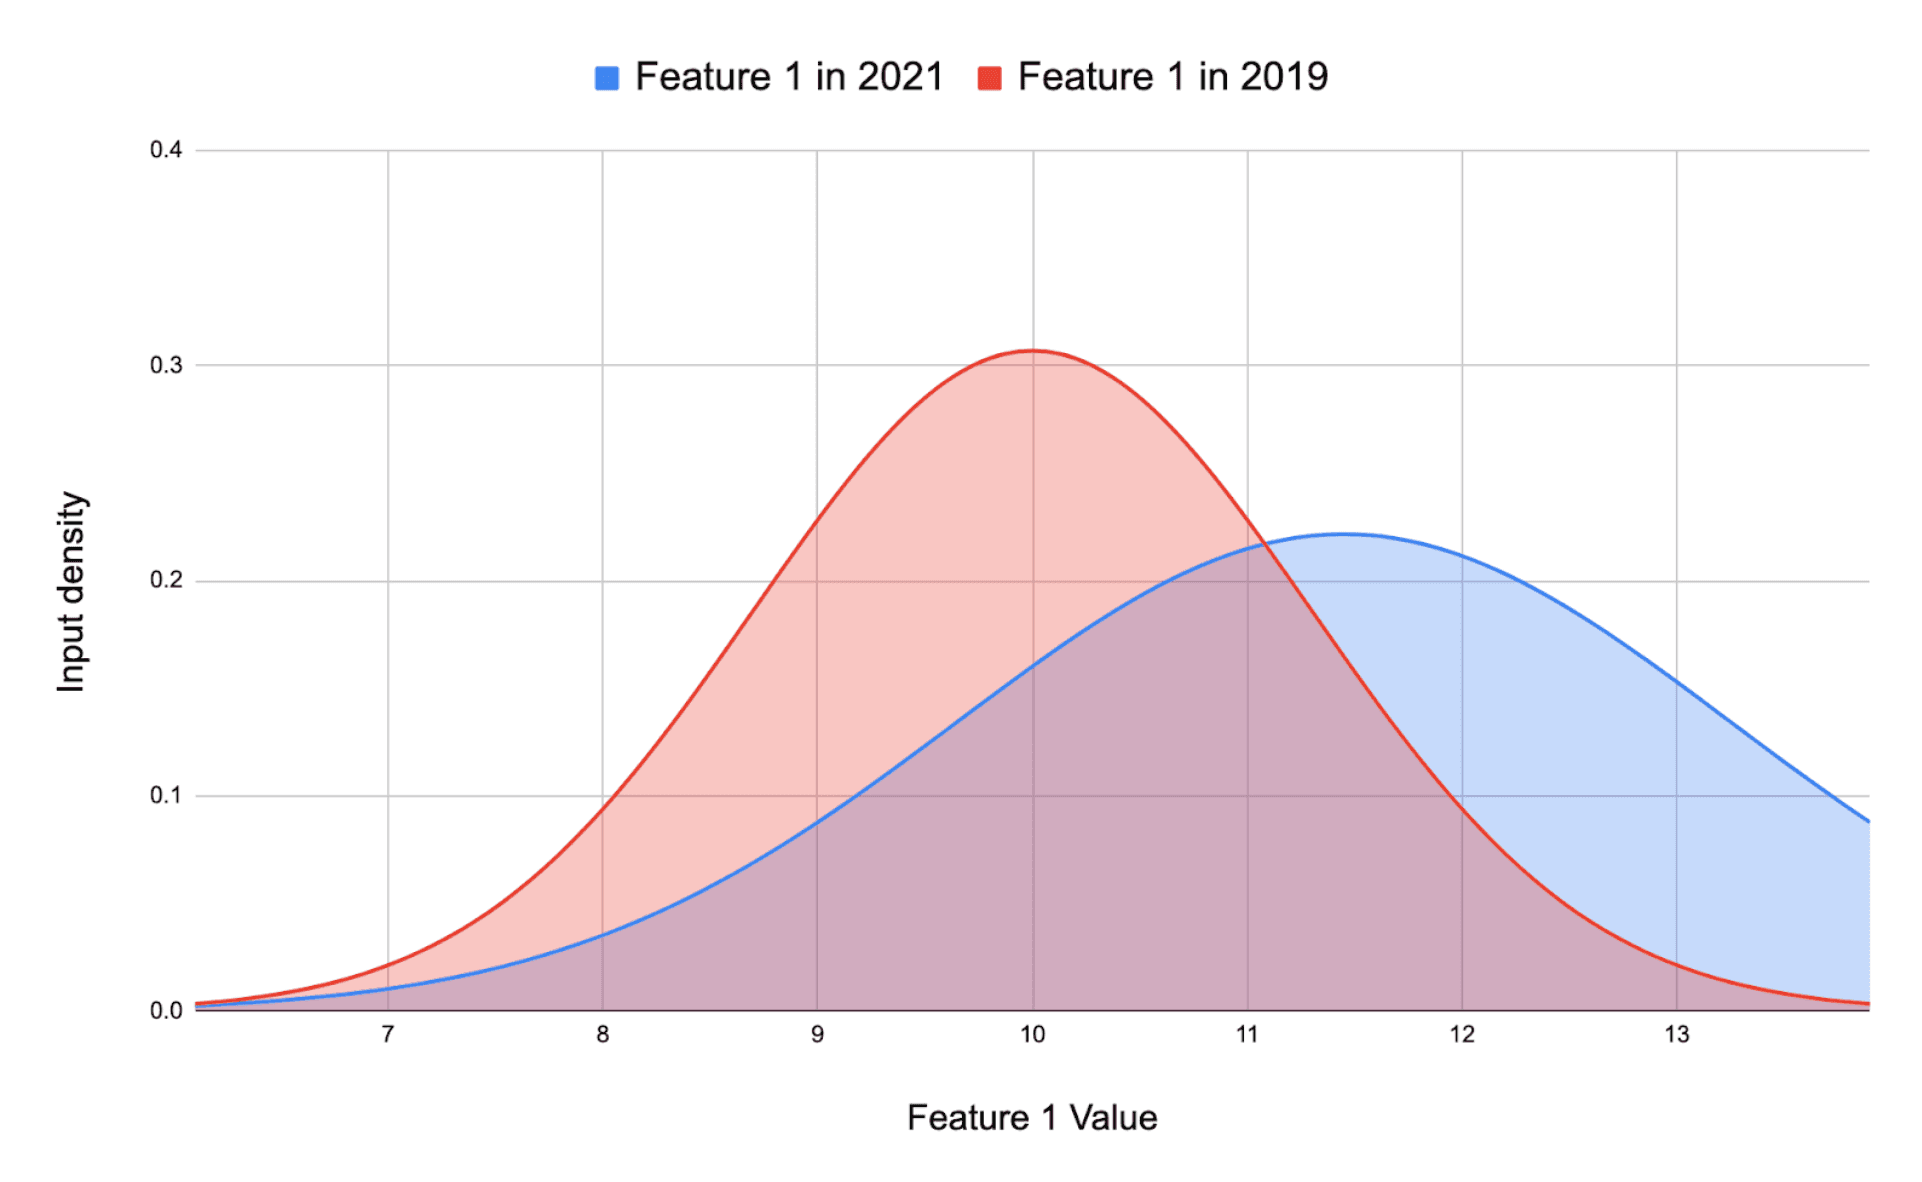
What is Data Drift and How to Detect it in Computer Vision?
Data-drift happens when the dataset that used to train your model doesn't mimic the data you receive in production, causing your model to underperform.
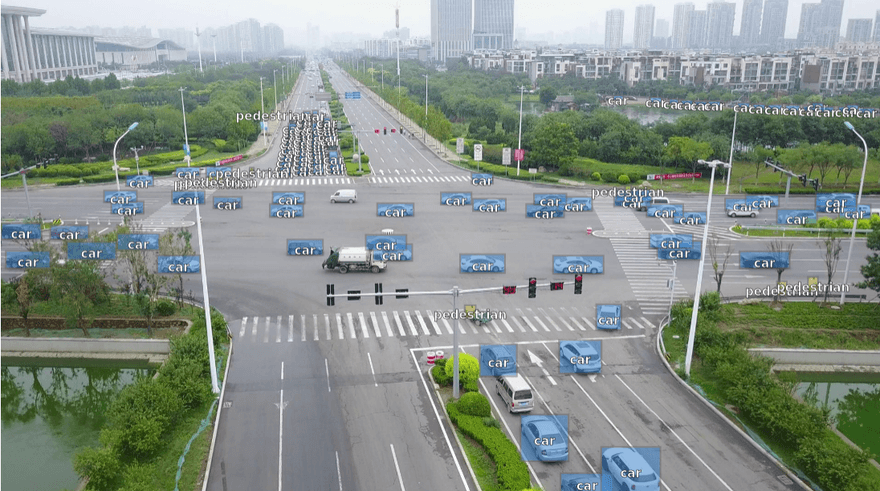
The Fastest Way to Analyze Models for Object Detection
Learn how to choose, tune and train any deep learning architecture to train your object detection models, by using an MLOps solution for computer vision.
Understanding the F1 Score in Machine Learning: The Harmonic Mean of Precision and Recall
In this article, we will delve into the concept of the F1 score, its relationship with precision and recall, andwhy it is advantageous to use the F1 score.
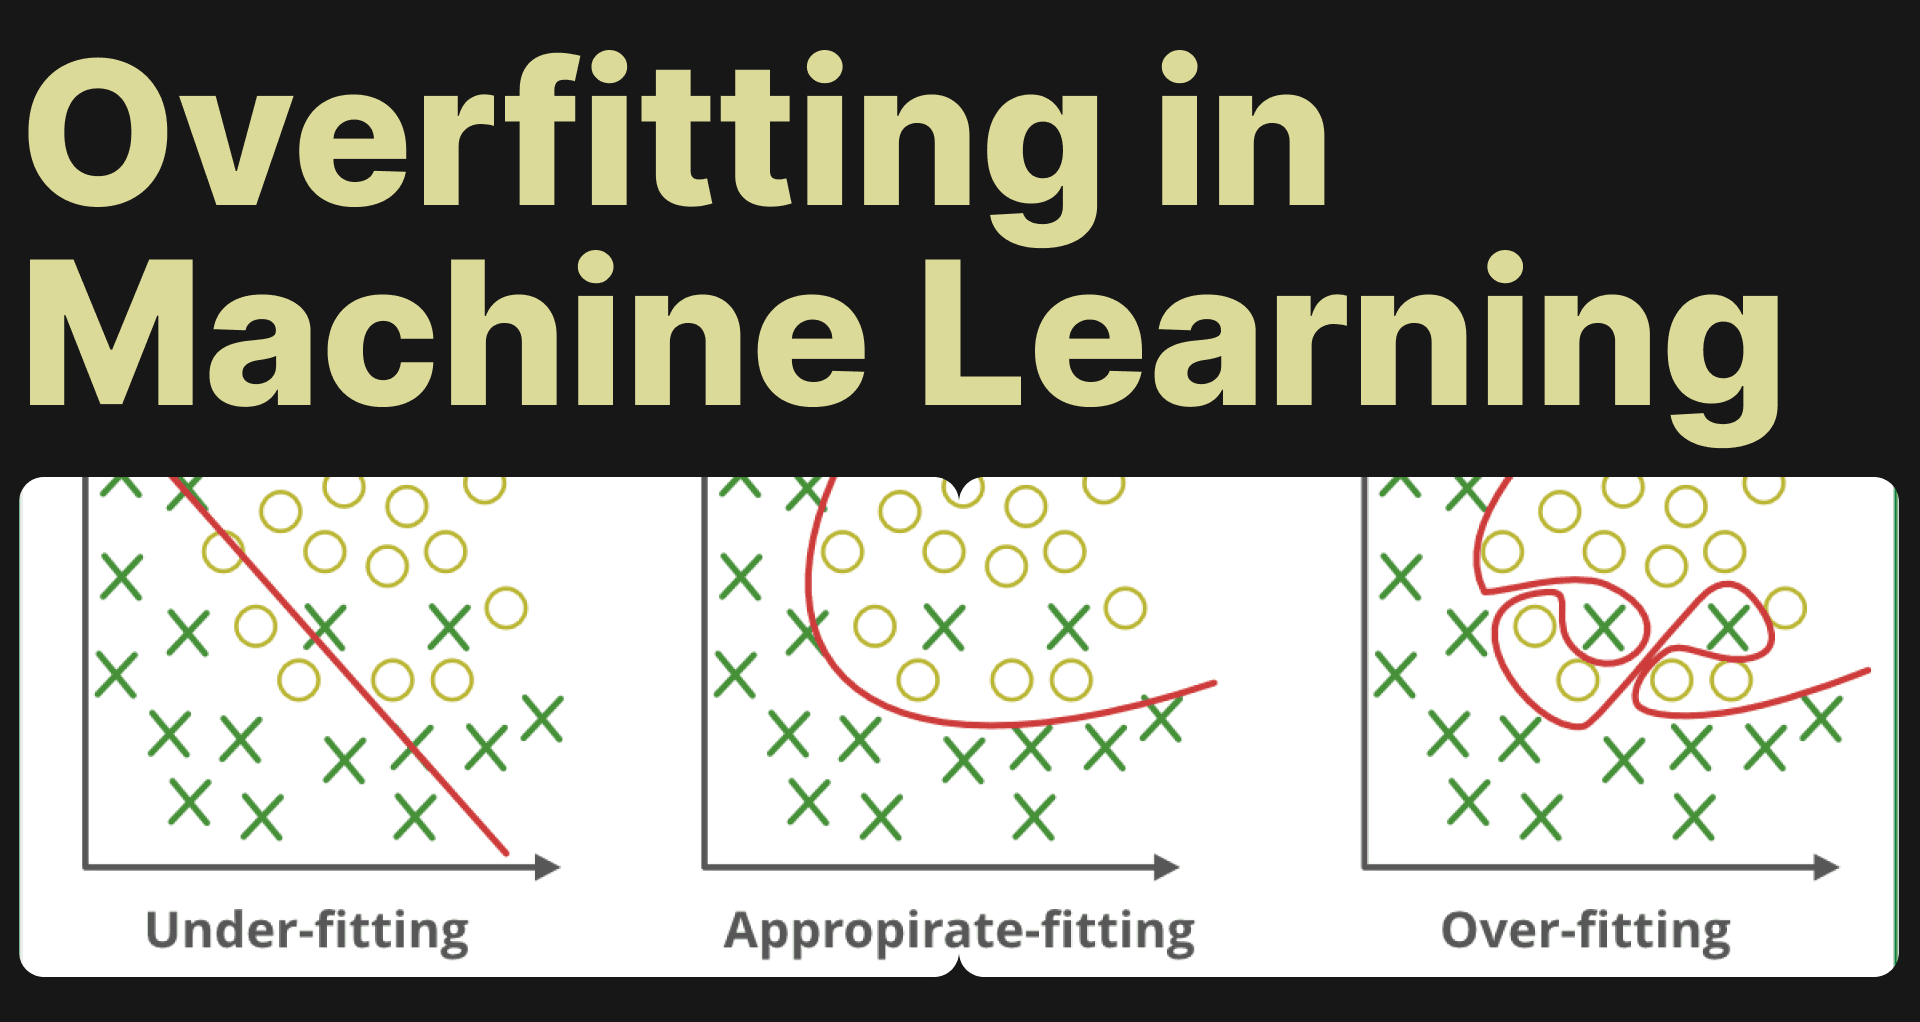
Understanding Overfitting in Machine Learning
Learn to tackle overfitting in machine learning with effective strategies and Picsellia's MLops platform. Avoid model memorization.