What is Data Drift and How to Detect it in Computer Vision?
Data-drift happens when the dataset that used to train your model doesn't mimic the data you receive in production, causing your model to underperform.
Picsellia Team
·6 min read
Put your MLOps into practice
Stop stitching tools together. Get an end-to-end CV platform with built-in automation.
Data-drift occurs when the dataset used to train your model does not mimic the data that you receive in production. This is when your model starts to act strange and underperform.
The difference between training and production data can be caused by multiple factors. It could be an inaccurate dataset creation, like using open-data not suited for your use-case. For example, if you use a road dataset built in Europe, it will highly vary from US roads. If you run your computer vision models on US roads, this will probably result in data drift.
Another reason could be the time interval between gathering data for testing and validation purposes and deploying it in real-time scenarios. Examples of this would be if there's an error in collecting your initial dataset; or seasonality cases that respond to the season you collected your initial dataset in (e.g., winter data/summer data).
How to Detect Data-Drift
When deploying a computer vision model, it's important to regularly monitor its performance. If the data used to train your model changes or becomes out-of-date, its effectiveness might be affected. This is called data-drift.
Let’s suppose we have a computer vision model built using a dataset of 100 different types of dog breeds, and we want to know if our accuracy decreases due to data-drift. For this, we’ll have to log all the new images and predictions ingested by our feedback loop system. Then we’ll need to review, edit or validate those predictions.
Now you have all the data needed to compare the initial predictions versus the edited ones and compute your performance metrics to see if they are above your average performance metrics.* *EASY, RIGHT?
 What is data drift and how to detect it with mlops
Well… Although this is the ideal approach, it means that you have to give access to a lot of people in order to validate all your predictions in real-time. In other words, you'll need the sufficient workforce to review all the predictions.
This suggests that we should consider some heuristic methods to detect data-drift in an unsupervised way. To do so, we’ll introduce a metric that comes out-of-the box if you use Picsellia deployment and monitoring solutions.
Kolmogorov–Smirnov Drift detection
The Kolmogorov–Smirnov test (KS test) is a statistical test that does not require any user input and is used to compare continuous or discontinuous, one-dimensional probability distributions. It can be applied to either comparing the sample's distribution with the reference probability distribution (one-sample KS), or two samples of populations' distributions having equal variability, in order to find out whether they are drawn from different population distributions of unknown parameters.
The method is named after Andrey Kolmogrov and Nikolai Smirnov, who first proposed it for use in very wide tables of random digits generated by humans.
**The Kolmogorov-Smirnov statistic is used to quantify the distance between the real-world data distribution functions of samples and the training set data distributions. **
You can find more information about KS Drift detection on the well detailed seldon’s library documentation here.
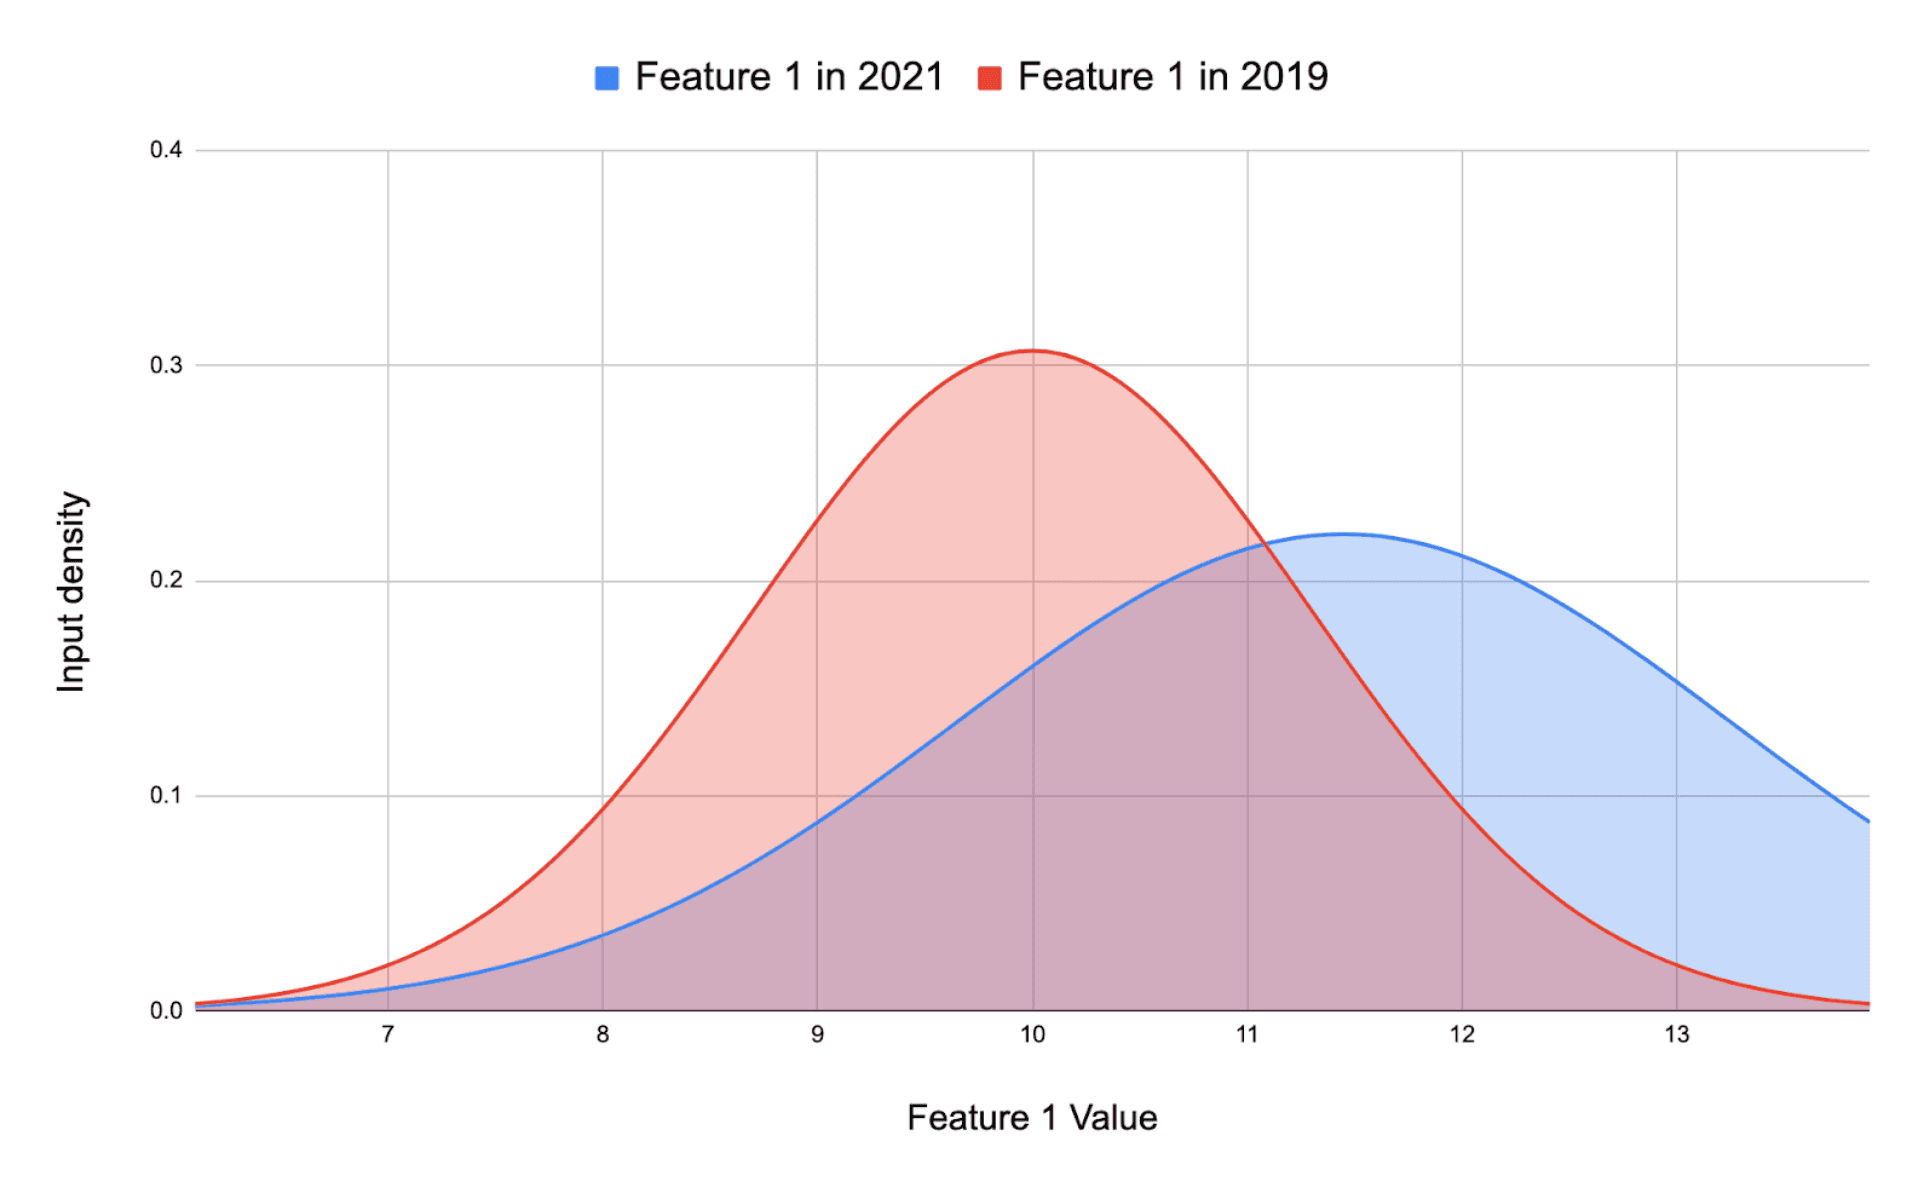
Basically, you will get a list of p-values for your training set and your real-world data, and the distance between these two curves will tell if there is a drift.
 What is data drift and how to detect it with mlops
Here, there is no drift.
What is data drift and how to detect it with mlops
Here, there is no drift.
* *
 What is data drift and how to detect it with mlops
Here, there is a data-drift.
What is data drift and how to detect it with mlops
Here, there is a data-drift.
How to Handle Data-Drift?
As we said before, data-drift happens when you train your models on images too different from the real-world data that your computer vision model sees in production. ***Now that we know how to detect it, how can we fix it as soon as possible? ***
There are multiple elements to consider before taking any action. Let’s assume that you have annotations for all these new images detected as data-drift. In this case, it is a good idea to not blindly hit "retrain."
Data drift signs that the input image stream has changed, but how and why?
First thing to check is the data coming into your feedback loop. The worst thing that could happen would be to ingest blank or deteriorated images into your data pipeline, caused by an error. However, checking this is easy if you have built an effective feedback loop visualization process**.**
If the quality of your data is OK, then you should check how your model is performing for your specific business case.
When we talk about data and prediction drift, we usually think about model performance decrease. Is the model still able to generalize its predictions? Or is the data-drift completely deteriorating your deep learning model’s performance?
There could be two different scenarios regarding your model’s performance.
- If the model is still performing as expected
→ Consider adding a percentage of the new images ingested through your feedback loop inside your training set and re-training your model. This way, you will have a better representation of reality but still keep your past accuracy.
- If the model is not performing as expected anymore
→ This means that the data you used for training and validation were not representative of the reality of your use-case, at all. In that situation, I'm sorry, but you will have to rebuild an entire dataset with the newly ingested images (if you have enough of them), or just wait until you have a decent amount of data to re-train your models.
Key Takeaway
Data-drift and concept-drift are two of the most common problems in computer vision applications. While data-drift refers to changes in the distribution of training data, concept-drift refers to changes in the underlying distribution of the problem itself. These problems can cause supervised learning models to break down. Luckily, there are some tools for detecting and mitigating these issues.
If you're looking for a platform that helps you monitor and automate your feedback loop to always detect data-drifts, stay tuned. At Picsellia we'll be releasing a new, better version that will enable you to do this, in one single platform. If you'd like to learn more about our monitoring and automated pipelines features, get in touch!
Related from Picsellia
Automate your ML pipelines
Set up continuous training and deployment with automated triggers, shadow deployments, and feedback loops.
Explore Automated PipelinesOrganize and version your datasets
Version, slice, and manage datasets with full traceability — from raw images to production-ready splits.
Explore Dataset ManagementStay up to date
Get the latest posts on computer vision, MLOps, and AI delivered to your inbox.
Related articles
The Cost of Tool-Switching in Computer Vision Pipelines
Tool overhead isn't additive — it compounds. Learn how context switching between ML tools costs CV teams hundreds of engineering hours per year.

Top 5 experiment tracking tools for Computer vision
AI is typically achieved through iterative and experimental processes such as changing the model, running multiple experiments, and examining the results.

Why Do Classical MLOps Tools Not Fit Computer Vision?
Computer vision pipelines require a set of processes that are exclusive to Computer Vision. This is where CVOps comes to play.