How to train YOLOv8 on a custom Dataset
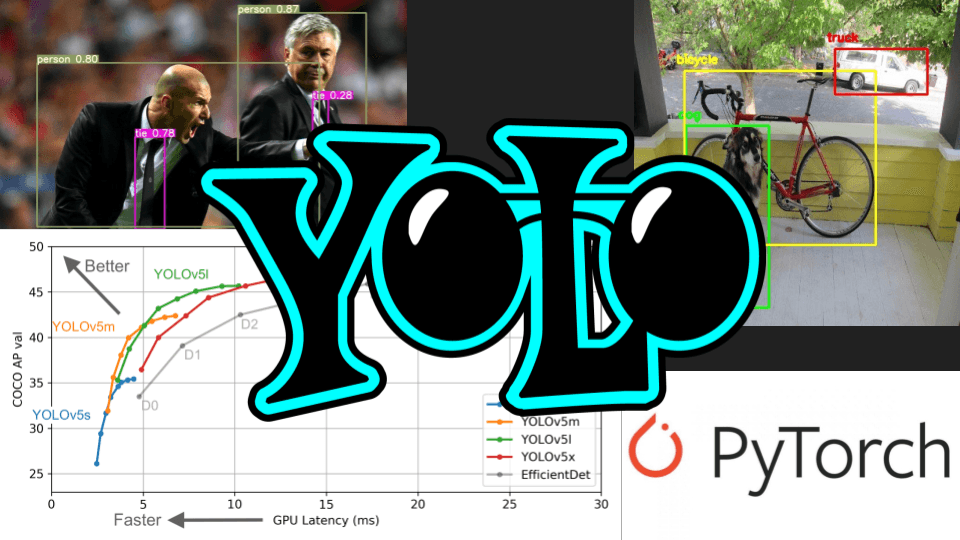
YOLOv8 is the most recent edition in the highly renowned collection of models that implement the YOLO (You Only Look Once) architecture.
Picsellia Team
·7 min read
Ready to try this yourself?
Get hands-on with Picsellia. Train, deploy, and monitor CV models from one platform.
YOLOv8 is the most recent edition in the highly renowned collection of models that implement the YOLO (You Only Look Once) architecture. This development was done by Ultralytics, a squad renowned for their work on YOLOv3 (pytorch fork) and YOLOv5.
Continuing the pattern set by YOLOv5, YOLOv6 and YOLOv7, we now have access not only to object detection, but also instance segmentation and image classification. The model itself was constructed in PyTorch, and is capable of running on both CPUs and GPUs. Similarly to YOLOv5, we also have several exports such as ONNX and Tensorflow SavedModel (which are not implemented yet).
The fact that we are still seeking the Papers with Code benchmark to distinguish YOLOv8 from the other state of the art real-time models is an issue to assess the “real SOTA claimed”. So, the only way to know if YOLOv8 can be a good fit for your use-case, is to try it out!
**In this tutorial, we will provide you with a detailed guide on how to train the YOLOv8 object detection model on a custom dataset. **You will learn how to use the fresh API, how to prepare the dataset and, most importantly, how to train and validate the model.
Let's get started!
In this article, we will try to explain how to quickly integrate this new architecture into your Picsellia Workflow.
The main things we are going to explore will be:
- How to build your object detection Dataset
- How to convert a COCO annotation file to YOLO Format
- Launch a training and interpret the results
- Use your model on new data.
Obviously, we made a github repo to help you with the coding, you can find it here:
https://github.com/picselliahq/yolo-notebooks
You can also find some relevant snippets in our documentation: https://documentation.picsellia.com/recipes
Build your Dataset with Picsellia’s Labeling Tool
Create your Dataset
 How to train yolov8 on a custom dataset
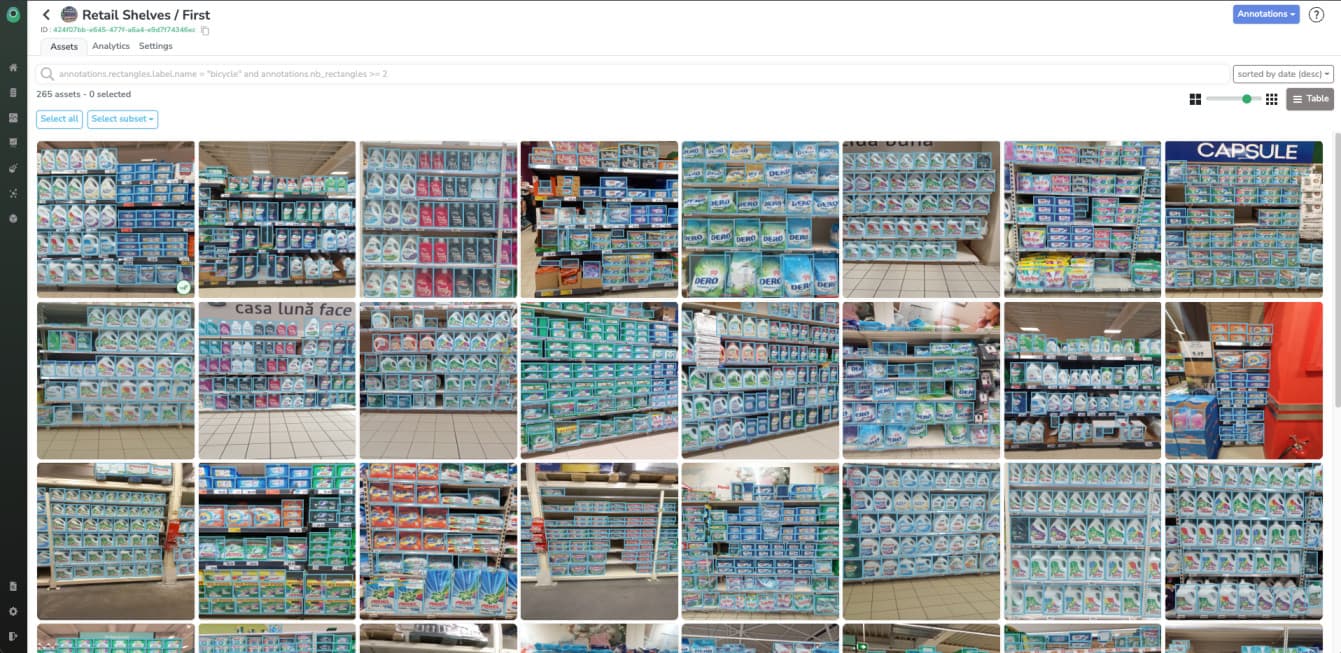
For this article we will use a retail dataset, kindly shared by our friends at Neurolabs (looking for a shelves monitoring solution? Go check them out!)
The first step to be done to use the Picsellia labeling platform is to set up your labels, here we are going to build a single class detection model, so let’s navigate to the settings and set this up. :)
Then we can annotate straight away, Picsellia Labeling interface is designed to be efficient and easy to use, you should be able to build your dataset really easily.
Now that we have our dataset annotated, (yes let’s imagine I annotated everything now), we have 14k+ objects annotated over 230 images.
 How to train yolov8 on a custom dataset
Let’s export the dataset in order to train your YOLOv8 model. Exports are made in COCO format on Picsellia.
The COCO Format
This format is one of the most common ones ( ;) ). COCO stands for Common Object in Common Situations! It’s a Json file containing 5 keys:
- info: this part of the structure gives information about the dataset, version, time, date created, author, etc
- licenses: this part gives information about the licenses which we have for our dataset
- category: it gives the id for annotations and objects detected along with the name also we can determine subcategories in it
- images: it stores images, file names, height width, time is taken, etc
- annotations: for the id’s we have for images it contains bounding box, segmentation coordinates area here bounding box is the x1,y1,x2,y2 coordinates of the object detected while the segmentation is the object outline iscrowd it's the binary parameter that tells if there are multiple objects on the scale we can't really segment each one of them we can convert them into one large box and indicate that with iscrowd parameter
 How to train yolov8 on a custom dataset
The YOLO format
 How to train yolov8 on a custom dataset
Unfortunately, YOLOvX algorithms do not read COCO format. Why? I don’t know.
They want a different way of reading the labels... based of .txt files
 How to train yolov8 on a custom dataset
**Every image in your dataset needs to have a corresponding .txt file with all the objects of the picture with a [class_id x0 y0 x1 y1] normalized. **
COCO to YOLO conversion
You will find in the repository a class called YOLOFormatter() that will do the trick for you :)
 How to train yolov8 on a custom dataset
We won’t be showcasing the actual code as it’s fairly simple, but you will be able to find it here:
https://github.com/picselliahq/yolo-notebooks/blob/main/utils/yolo.py
Please note that in the repo, you will be able to convert your BBOX, polygons and classification annotations into yolo format.
How to train YOLOv8 on your custom dataset
The YOLOv8 python package
 How to train yolov8 on a custom dataset
For YOLOv8, the developers strayed from the traditional design of distinct train.py, detect.py, val.py, and export.py scripts.
Providing one unified API in order to do everything :)
**Pros: **Easier to go from 0 to a trained and validated model!
**Cons: **Way harder to tweak the code to add integrations for example, like Custom Trainer Callbacks or a modified NMS algorithm.
You will be able to find more information about the API directly on Ultralytics documentation.
Now let’s see how easy it is to launch a training :)
 How to train yolov8 on a custom dataset
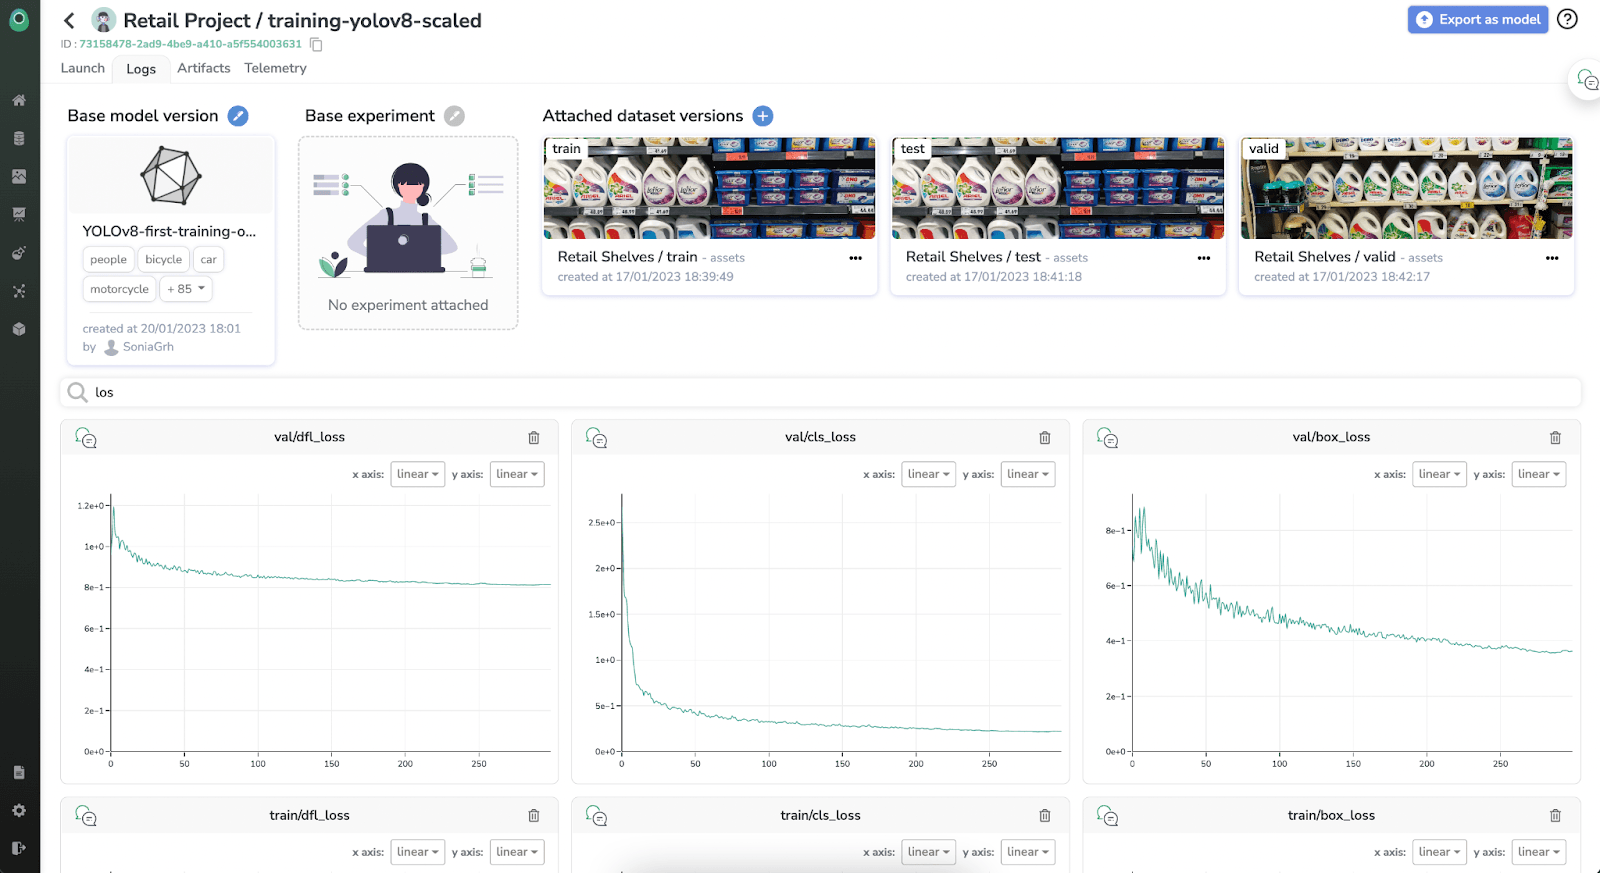
Interpreting the results
Launching training is pretty straightforward with YOLO models, at least for v5, 7 and 8. The only thing that might be confusing is the amount of logs and metrics generated.
The main metrics computed and stored are:
F1-Score
The F1-score is a commonly used metric for evaluating the performance of a binary classification model. It is the harmonic mean of precision and recall, where precision is the number of true positive predictions divided by the total number of true positive and false positive predictions, and recall is the number of true positive predictions divided by the total number of true positive and false negative predictions. The F1-score ranges from 0 to 1, with 1 being the best possible score. It is particularly useful when the class distribution is imbalanced, as it takes into account both the precision and recall of the model.
Recall
Recall refers to the ability of a model to correctly identify all relevant instances within a dataset. It is often used as a metric for evaluating the performance of a model in classification tasks, particularly in cases where the dataset is imbalanced or the cost of false negatives is high. Recall is calculated as the number of true positive predictions divided by the sum of true positive predictions and false negative predictions. A high recall value indicates that the model has a low rate of false negatives, meaning it is able to correctly identify most of the relevant instances in the dataset.
Precision-recall
Precision is the proportion of true positive predictions among all positive predictions made by the model, while recall is the proportion of true positive predictions among all actual positive instances in the dataset.
A precision-recall curve is a plot that shows the trade-off between precision and recall for different threshold settings. In a precision-recall curve, precision is plotted on the y-axis and recall is plotted on the x-axis. By changing the threshold setting, a different point on the precision-recall curve can be obtained.
Use your trained model
It’s really easy to run your models once it is trained, Ultralytics made a simple CLI to do it.
 How to train yolov8 on a custom dataset
The only thing that you need to specify is the path to your weights file. You can either use **.pt **or **.onnx. **
VOILA!
Related from Picsellia
Train models your way
Use pre-built pipelines for YOLO, SAM2, and more — or bring your own code with PyTorch, TensorFlow, or Hugging Face.
Explore the AI LaboratoryAnnotate faster with AI assistance
Picsellia's labeling tool supports bounding boxes, polygons, and segmentation masks with built-in AI assistance to speed up annotation.
Explore the Labeling ToolStay up to date
Get the latest posts on computer vision, MLOps, and AI delivered to your inbox.
Related articles
Train and integrate YOLOv8 with Picsellia in just a few minutes
In this tutorial, we will provide you with a detailed guide on how to train the YOLOv8 object detection model using Picsellia.
How to Train YOLOv5 on a Custom Dataset, Step by Step
We'll show you the step by step of how to easily train a YOLOv5, by using a complete MLOps end-to-end platform for computer vision use-cases.