Understanding the F1 Score in Machine Learning: The Harmonic Mean of Precision and Recall
In this article, we will delve into the concept of the F1 score, its relationship with precision and recall, andwhy it is advantageous to use the F1 score.
Picsellia Team
·7 min read

Ship models faster
Track experiments, compare runs, and iterate faster with built-in tooling.
Introduction:
In the field of machine learning, accurately evaluating the performance of a model is crucial. Metrics such as precision, recall, and the F1 score play a significant role in assessing the effectiveness of a classification model. In this article, we will delve into the concept of the F1 score, its relationship with precision and recall, why it is advantageous to use the F1 score over solely relying on recall or precision, how to interpret the results, how to use the F1 score in machine learning with a computer vision example, and finally, introduce the concept of a confusion matrix to calculate the F1 score.
Understanding Precision and Recall:
Before we explore the F1 score, it is important to comprehend two fundamental metrics: precision and recall.
Precision:
Precision measures the proportion of correctly predicted positive instances out of all instances predicted as positive. It helps us understand how well the model classifies positive instances correctly. A high precision value indicates that the model has a low false positive rate.
Precision is calculated using the formula:
 Understanding the f1 score in machine learning the harmonic mean of precision and recall 646f6d5cd7373ddc1cbc8ce8 ce88bfab
where:
- True positives are the correctly predicted positive instances
- False Positive represents instances wrongly predicted as positive.
Precision is particularly useful when the goal is to minimize false positives. False positives occur when negative instances are incorrectly classified as positive by the model. For example, in email spam detection, a false positive would mean classifying a legitimate email as spam.
Recall:
Recall, also known as sensitivity or true positive rate, measures the proportion of correctly predicted positive instances out of all actual positive instances. It provides insights into how well the model identifies positive instances. A high recall value indicates that the model has a low false negative rate.
Recall is calculated using the formula:
 Understanding the f1 score in machine learning the harmonic mean of precision and recall 646f6d5c4d8cc8dc4f5306e7 d6e8fb07
where:
- True positives are the correctly predicted positive instances
- False Positive represents instances wrongly predicted as negative.
Recall is particularly useful when the goal is to minimize false negatives. False negatives occur when positive instances are incorrectly classified as negative by the model. For example, in a medical diagnosis scenario, a false negative would mean failing to identify a disease or condition when it is actually present.
But what if we want to find the best tradeoff between Precision and Recall? We should find a way to calculate a metric that takes into account both of these and optimize it! Well, the harmonic mean is a great concept to calculate this.
The harmonic mean is a mathematical concept used to calculate an average value in a way that gives equal weight to each value being averaged, regardless of their magnitude. It is commonly used when dealing with rates, ratios, or other quantities that involve reciprocals.
It is calculated by taking the reciprocal of each value, calculating the arithmetic mean of the reciprocals, and then taking the reciprocal of the result. Mathematically, the harmonic mean of n values, x1, x2, ..., xn, is given by:
 Understanding the f1 score in machine learning the harmonic mean of precision and recall 646f6d60cabd245d7cc955ba 970413e8
Here are a few key points to understand about the harmonic mean:
- **Equal Weighting: **Unlike the arithmetic mean, which gives equal weight to each value being averaged, the harmonic mean gives equal weight to each value's reciprocal. This means that smaller values have a more significant impact on the harmonic mean than larger values.
- **Influence of Extreme Values: **The harmonic mean is strongly influenced by small values. If there is even a single small value in the set of values being averaged, the harmonic mean will tend towards that value.
- Use for Rates and Ratios: The harmonic mean is particularly useful for averaging rates, ratios, or other quantities that involve reciprocals. For example, it is commonly used to calculate average speeds or average rates of work.
In the context of evaluating the F1 score, the harmonic mean is used to combine precision and recall. Since both precision and recall are rates (ratios) between 0 and 1, the harmonic mean helps balance these two metrics by considering their reciprocals. This ensures that a low value in either precision or recall has a significant impact on the overall F1 score, thus incentivizing a balance between the two.
Track F1, precision, and recall automatically
Picsellia computes F1 score, mAP, precision, recall, and 10+ metrics for every experiment — no manual calculation needed. Compare runs side by side.
Join hundreds of CV engineers who ship models faster with Picsellia
Introducing the F1 Score:
The F1 score combines precision and recall into a single metric, providing a balanced evaluation of a model's performance. While recall and precision are important individually, using them alone may not provide a comprehensive assessment. The F1 score takes into account both metrics and their harmonic mean, allowing us to strike a balance between minimizing false positives and false negatives. The F1 score ranges from 0 to 1, where 1 represents perfect precision and recall, and 0 indicates poor performance.
Advantages of Using the F1 Score:
The F1 score offers several advantages over solely relying on recall or precision:
- Balance between Precision and Recall: The F1 score considers both precision and recall and gives equal importance to both metrics. This ensures that the model is not solely optimizing for precision or recall but rather striking a balance between correctly predicting positive instances and minimizing false positives and false negatives.
- Robustness to Imbalanced Datasets: In scenarios where the dataset is imbalanced, meaning one class has significantly fewer instances than the other, using the F1 score helps mitigate biased evaluations. Since the F1 score accounts for both precision and recall, it provides a fair assessment of the model's performance in such cases.
Interpreting Results and Using the F1 Score in Machine Learning:
Interpreting the F1 score depends on the specific problem and context. A high F1 score indicates a well-performing model with good precision and recall. On the other hand, a low F1 score suggests room for improvement, highlighting potential issues with either precision or recall.
Let's consider an example of object detection using a model that identifies cars in images. We want the model to have high precision to ensure that when it predicts a car, it is indeed a car (minimizing false positives). At the same time, we also want high recall to capture as many actual cars as possible (minimizing false negatives). By using the F1 score, we can evaluate the model's ability to strike a balance between precision and recall, providing a comprehensive assessment of its performance.
To calculate the F1 score, we can use a confusion matrix, which summarizes the predictive performance of a model on a binary classification task (positive and negative classes). The confusion matrix consists of four key components:
- True Positives (TP): Instances correctly predicted as positive.
- True Negatives (TN): Instances correctly predicted as negative.
- False Positives (FP): Instances wrongly predicted as positive.
- False Negatives (FN): Instances wrongly predicted as negative.
Using these components, we can calculate the F1 score using the following formula:
 Understanding the f1 score in machine learning the harmonic mean of precision and recall 646f6d5cc49942bb62b1ec4b 1e19e32d
Conclusion
The F1 score is a powerful metric in machine learning for evaluating the performance of classification models. By incorporating both precision and recall, it provides a balanced measure of a model's ability to classify positive instances accurately while minimizing false positives and false negatives. Utilizing the F1 score, alongside precision and recall, allows machine learning practitioners to make informed decisions when developing and fine-tuning their models. Furthermore, the F1 score's advantages, interpretability, and applicability in various domains, such as computer vision, make it an essential tool for evaluating and optimizing machine learning models.
Stop computing metrics in notebooks
Picsellia auto-computes F1 score, precision, recall, confusion matrices, and more — for every training run. Track model performance across experiments effortlessly.
Join hundreds of CV engineers who ship models faster with Picsellia
Related from Picsellia
Track every experiment
Log metrics, parameters, and artifacts automatically. Compare runs side by side and ship better models faster.
See Experiment TrackingShip vision AI 10x faster
Picsellia is the end-to-end MLOps platform for computer vision — from data management to production deployment.
See the PlatformStay up to date
Get the latest posts on computer vision, MLOps, and AI delivered to your inbox.
Related articles
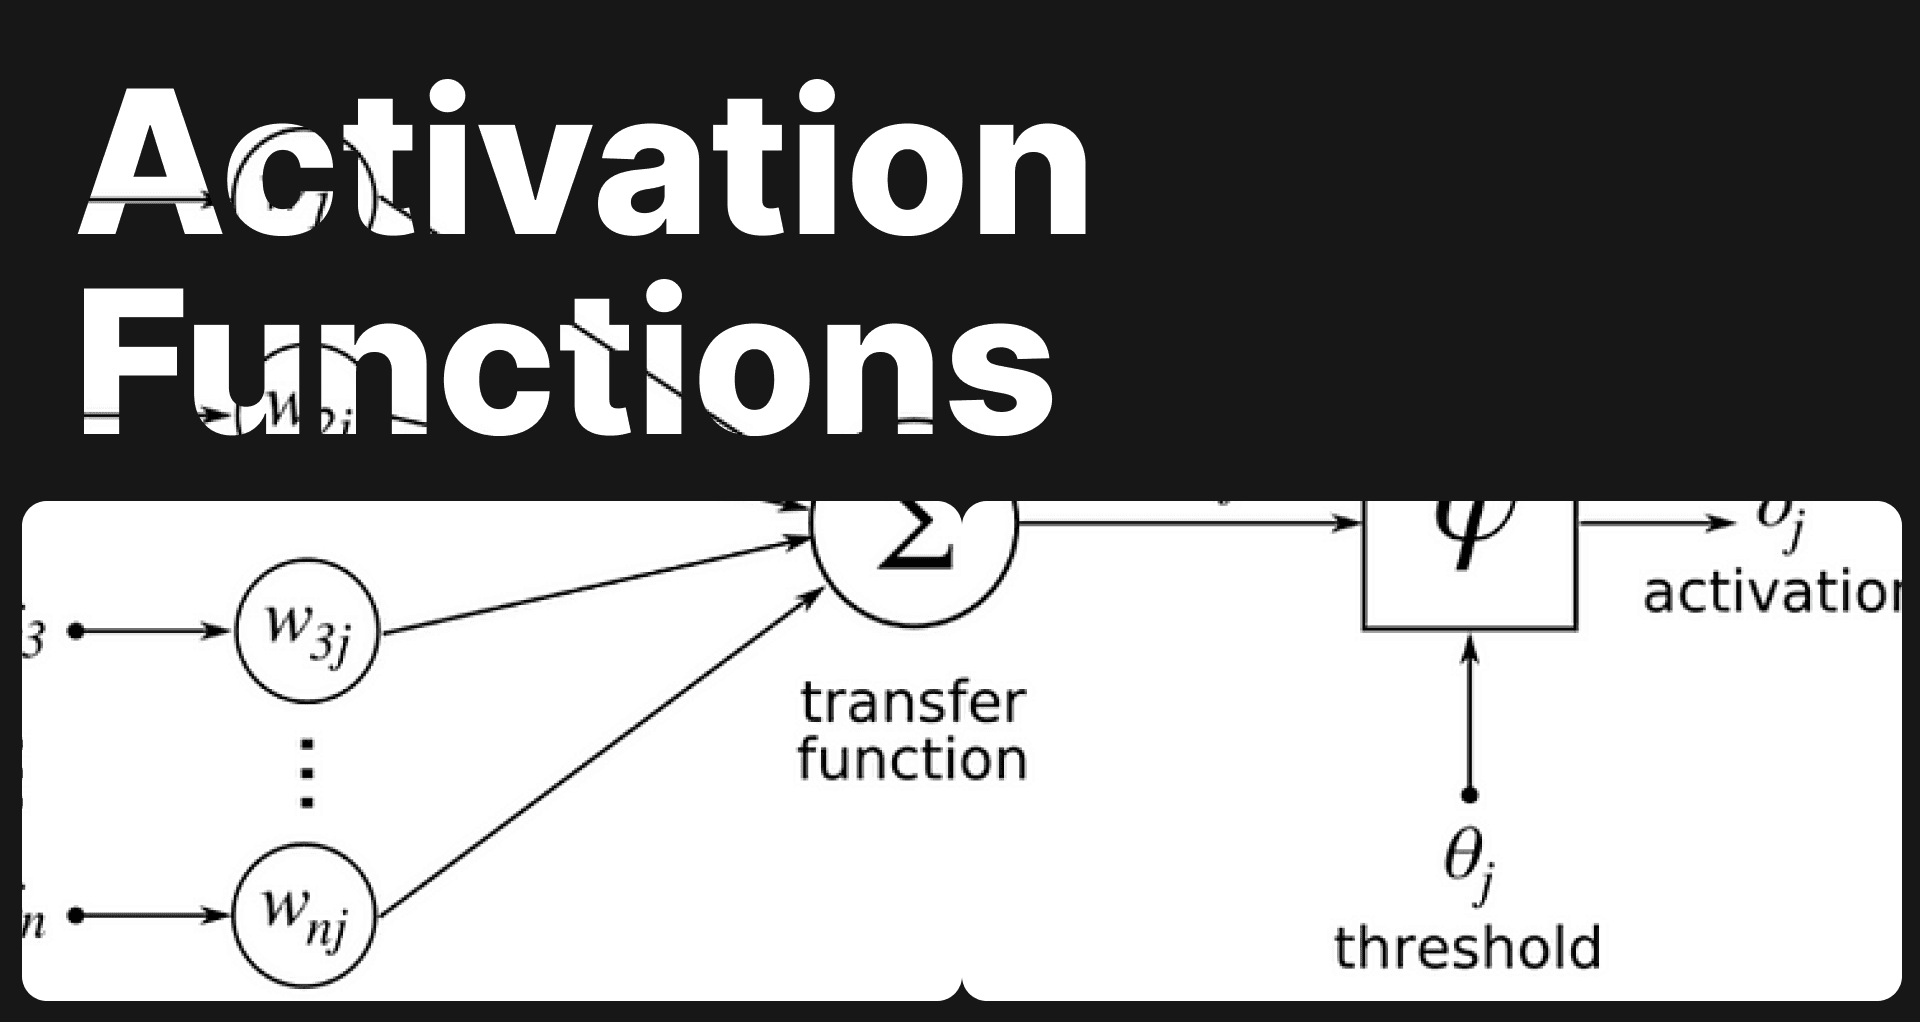
Activation Functions and Neural Networks
Explore the key roles of activation functions in neural networks for computer vision tasks. Learn about Sigmoid, ReLU, and more for better deep learning.

Mask R-CNN - Everything explained
Explore Mask R-CNN: a groundbreaking tool in computer vision for object detection & instance segmentation. Dive deep into its architecture & applications.
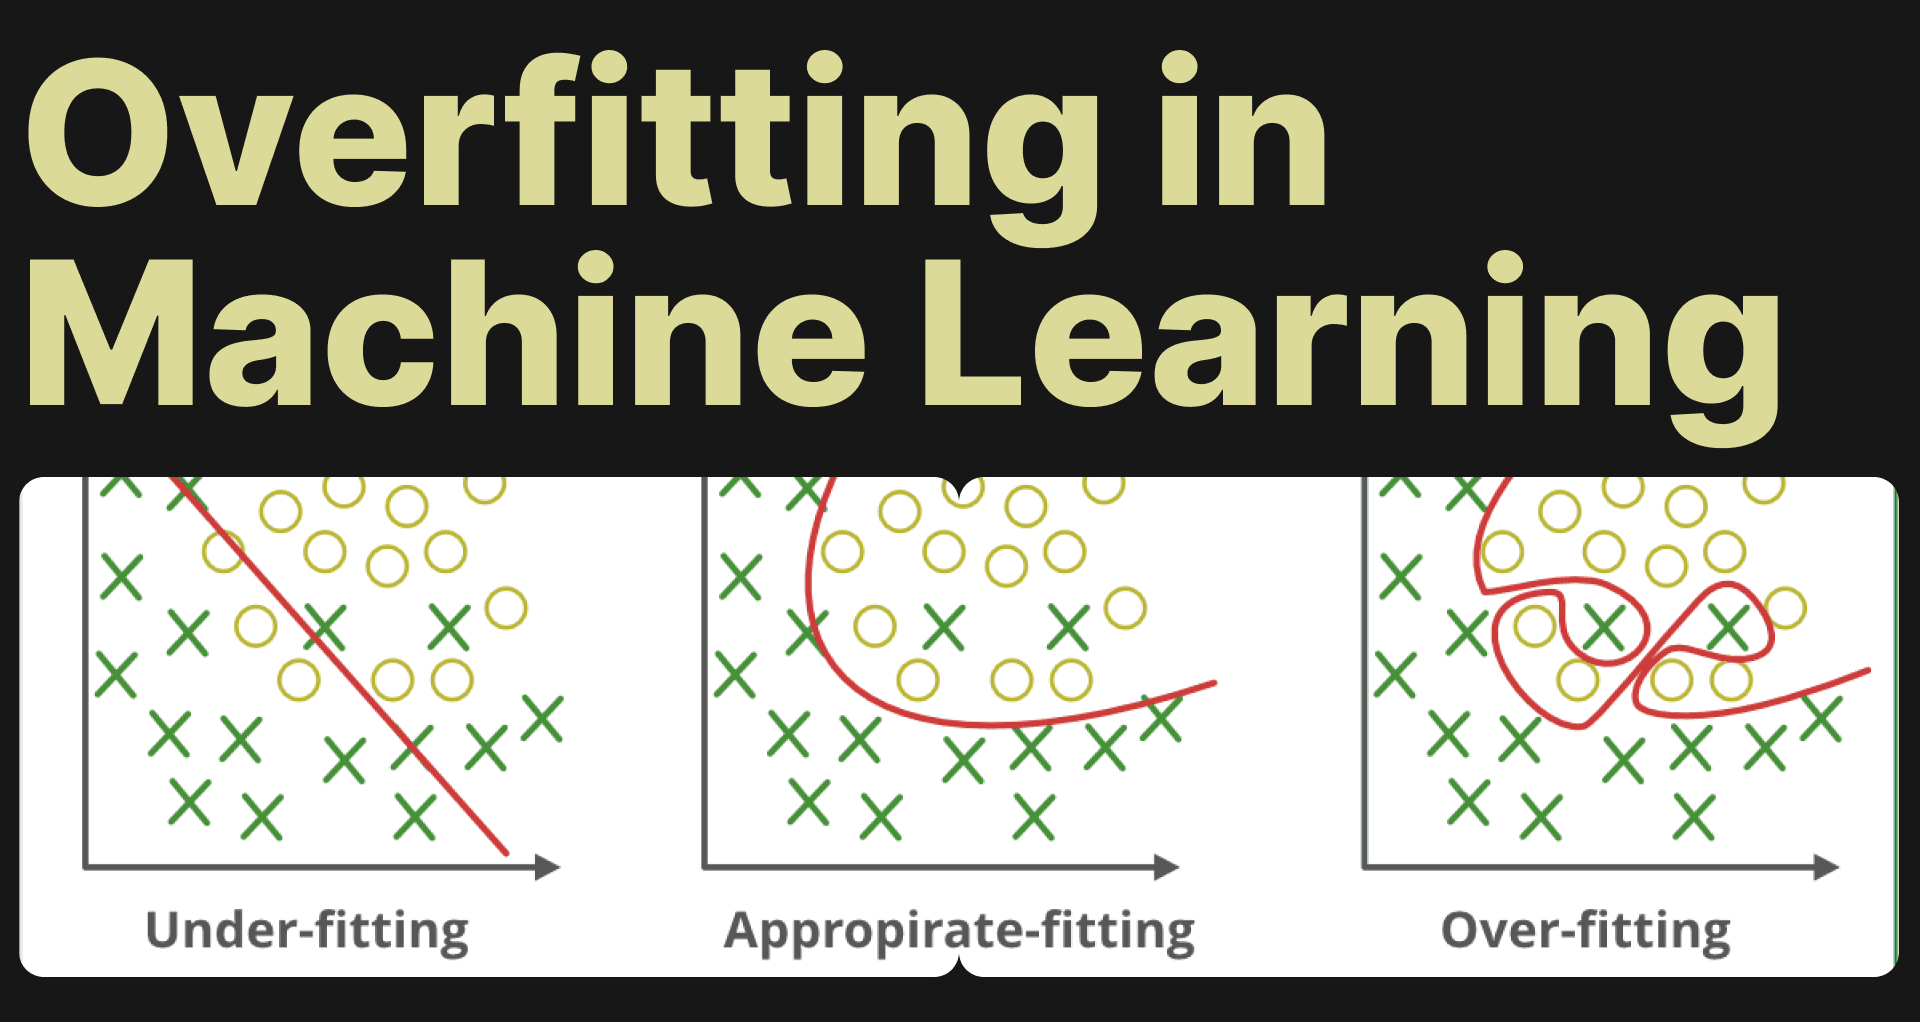
Understanding Overfitting in Machine Learning
Learn to tackle overfitting in machine learning with effective strategies and Picsellia's MLops platform. Avoid model memorization.